Line Contour Thickness Editing
New in FX-Net verson 3.41 is the ability to change line contour thickness and individual product density. We will begin with a quick lesson on changing a line contour's thickness.
When you overlay several types of data using line contours, FX-Net draws all the contours with identical thickness. Sometimes, you may want to change the thickness of the contour to make it easier for you to read. An example of how to do this follows.
Note:
this will not change the thickness of any of the text included
in the product, for example H and L symbols or line coutour labels.
 |
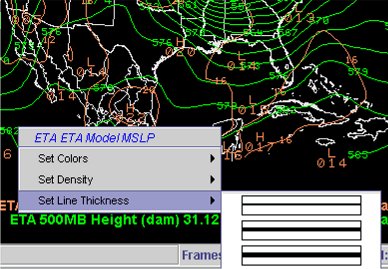
In my FX-Net primary window, I loaded Eta 500MB Height and Mean Sea Level Pressure (MSLP). I want to change the thickness of the MSLP to a thicker line to make it easier for me to read, so I right-click the ETA 500MB Height title on the bottom right of the window. This opens a pop-up menu, from which I select Set Line Thickness, as shown to the left. The resulting cascading menu has three line thickness settings. The top is the default. I choose the middle, then the MSLP lines are changed to a thicker line. A section of the resulting image is below. |

Editing an individual product's density
New in an
earlier version of FX-Net was the ability to change the density of the
contours of numerical model data using the Global Density menu
on the FX-Net toolbar. However, this changed the density of ALL products
loaded into the primary window. Now, in FX-Net version 3.41, you can edit
the density of individual products in the FX-Net window, overriding the
Global Density setting. A quick example of how to do this follows.
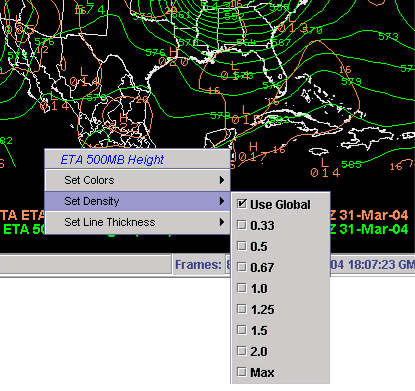
| Once you have data loaded in the primary window (in this case Eta 500mb Height and MSLP), right-click the product legend that you want to change the density of. A menu like the one to the right will open. As you can see, the default setting is Use Global. You can override this setting by selecting a density from this menu. 0.33 is the lowest and Max is the highest density you can select. Once you select a density, the data will be redrawn in the primary window. In my example, I selected 0.33, and part of the resulting image is shown below. Compare the difference in 500mb height (green) contour spacing over the southeast US in the image to the right, to the spacing in the finished image below. |  |
