| Zoom In/Out | Loop Properties | Overlaying Data Sets |
| Line Contour Color Editing | Hiding Unwanted Images |
FX-Net allows you to zoom in and out on data sets very easily. Remember though, that as you zoom in, you lose detail on certain types of data. The best plan is to load your data on the smallest map scale possible in the primary window. This way, the highest resolution data will be loaded, and the need to zoom will be diminished.
To zoom in on data, you may use one of two methods. If you have a three-button mouse, you may simply place the cursor over the spot you want to zoom in on, and middle-click your mouse. If you only have a two-button mouse, you may hold down the Alt key on your keyboard while left-clicking your mouse. In fact, the Alt key/left-click method works for both types of mice.
To zoom out, simply left-click and FX-Net will zoom out.
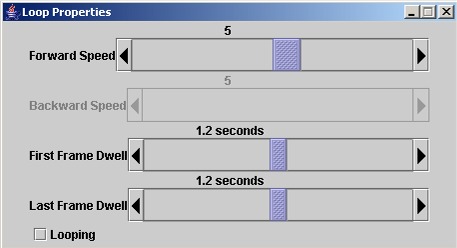
Loop Properties Control Panel
Using FX-Net, you may create loops of almost any type
of data available, as long as you have more than one frame selected in
the Frames on your toolbar. To control
the loop, use the buttons on your toolbar
(first frame, previous frame, next frame, last frame, loop on/off).
You may control the speed of the loop using the Loop Properties Control
Panel.
Clicking
on the ![]() on the tool bar brings up a panel just like the one linked just below.
Using these sliding bars, you can control the speed of the loop and the
amount of time it will dwell on the first and last frame.
on the tool bar brings up a panel just like the one linked just below.
Using these sliding bars, you can control the speed of the loop and the
amount of time it will dwell on the first and last frame.
Loop Properties Control Panel Dialog Box
The ability to overlay data sets is a strength of FX-Net. This is a powerful tool, and allows you to view different types of data side-by-side. For example, you may load a loop of satellite data, then load a loop of the Eta model's forecast 500 mb heights. FX-Net will time-match the Eta 500 mb heights to the satellite data already loaded in the primary window. This would allow you to see the upper air features and how they are influencing the cloud cover present. Or, you may load Eta, NGM and AVN 500 mb heights in the same window, giving you a unique opportunity to compare how they differ or are similar for the same forecast time period.
You may load up to 8 products in the primary window at once, BUT only one may be of an image type (satellite, radar, model image). The window may get cluttered and difficult to analyze, so you may toggle the products on and off to make it easier. To do this, simply left-click on the title of the product that you want to remove in the bottom right of the primary window. The product is still loaded, but it becomes invisible. You may make it reappear by left-clicking the title again.
As a rule, you cannot overlay two images, i.e. satellite and radar or model image and satellite/radar. Also, you cannot overlay upper air data with any other type, or plan view forecasts with time height or cross section forecasts.
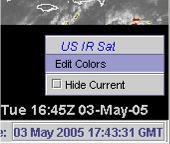
New in version 4.0 is the ability to hide unwanted images from a time series of imagery. When you load a sequence of images, you may "hide" one or many using the product legend pop-up window. To accomplish this, when imagery is fully loaded, navigate to the image you wish to hide, then right-click on the product legend on the bottom right of the primary window. To the right you will see this pop-up menu. Click the Hide Current checkbox and that image will not show up when navigating through your time series or when looping. If you wish to hide multiple images in a time series, you must do this for each image you wish to hide. FX-Net will not omit this image, but will show a blank window in it's place.
When
you overlay several types of data using line contours, FX-Net picks the
colors for the line contours for you. Sometimes, you may want to
change the color of the contour to make it easier for you to read.
An example of how to do this follows.
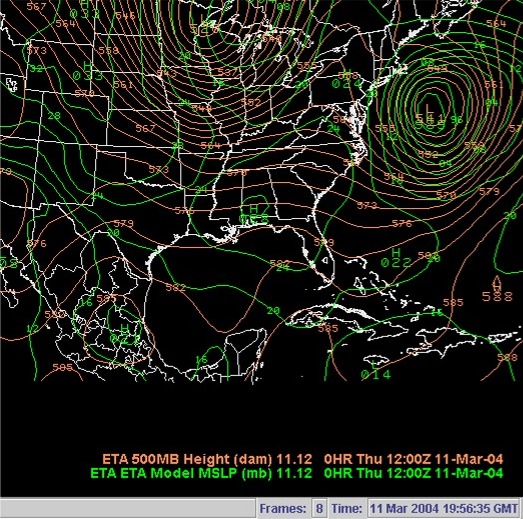 |
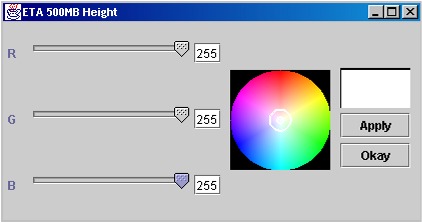
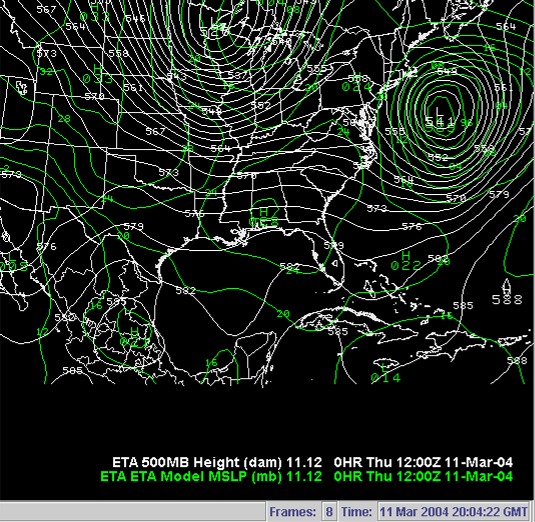
In the image on the left, I loaded Eta 500MB Height and MSL Pressure. I want to change the color of the 500MB height to another color to make it easier for me to read, so I right-click the ETA 500MB Height title on the bottom right of the window. This opens a pop-up menu as shown below. |
| You may use your mouse pointer to select a color from the menu that pops up, or you may select choose color... and that opens up the custom line color editor below. | 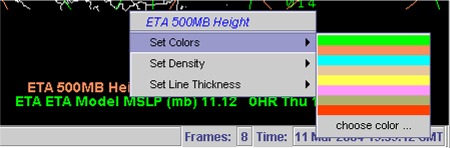 |
| When it first appears, the editor appears as the top box. I can now change the color to a more preferable color. I can do this by sliding the RGB controls on the left side, or I may move the centroid in the color circle to a new color. Either way, as I change the color, the color that the contours will now be is represented in the box in the upper right (swatch). I select white, by dragging the centroid in the color circle to the middle. I then click Apply, and then, Okay. | 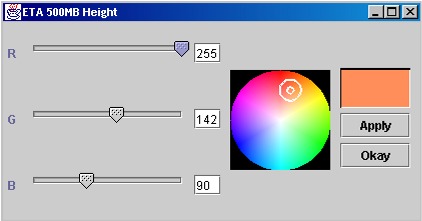
|
 |
Now, here's my new display (though not the whole FX-Net window). The 500MB Height contours are now white, and easier for me to read. You may change any contours this way, and change them as many times as you like. |