|
|
|
|
|
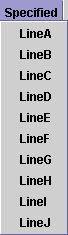
In the volume browser, the second choice of views is Cross Section. A cross section is a vertical slice of the atmosphere between two points. Use this quick discussion of cross sections if you want a better idea of what they are. The menu in the volume browser specific to cross section view is the Planes menu. There is one menu to use to choose baselines for your cross section: Specified. The content of this menu is shown to the right. |
|
Creating a cross section using editable Baselines
Using the
editable baselines, you may create cross sections. With Cross
Section view selected in the volume browser, under Planes
in the Specified menu there are several lines, e.g. LineA,
LineB, etc. Each of these is a baseline to use to construct
your cross section. Before you use these baselines for creating cross
sections, you should load the baselines and points in the FX-Net main
window, and move them to locations from where you would like to view data.
How do I do this?
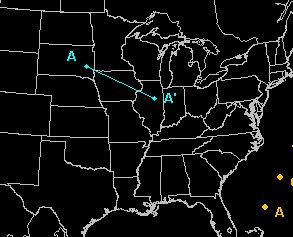 |
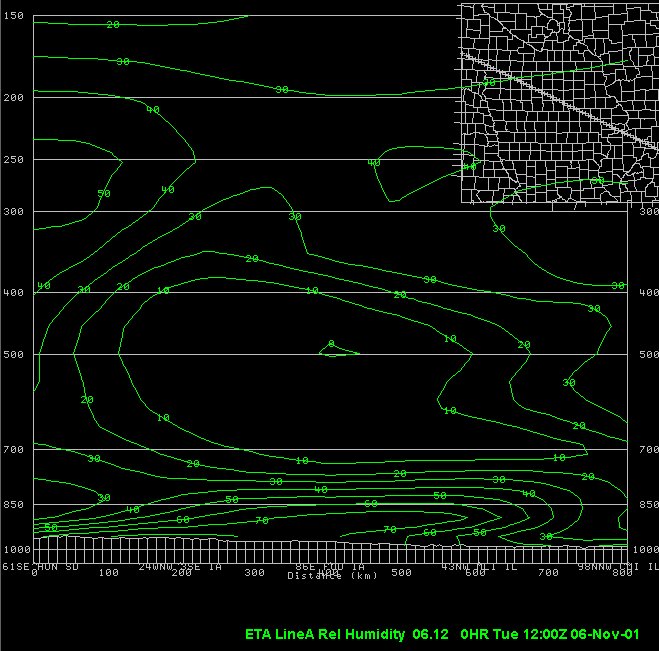
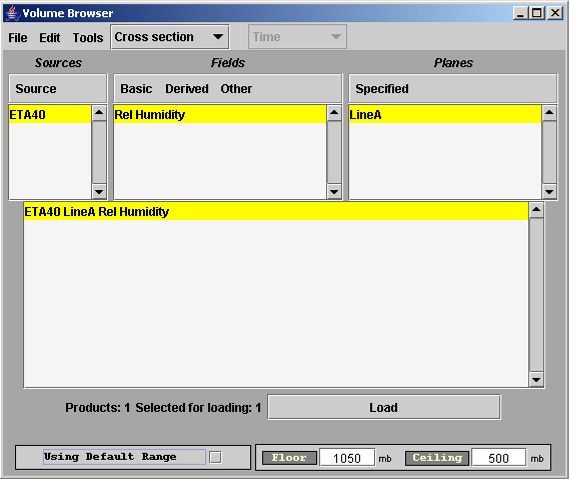
In this example, I am creating a cross section of relative humidity along LineA. First, I loaded the baselines in the main FX-Net window, and moved LineA to a position shown in the image to the left. I selected 8 frames on the FX-Net tool bar, then Volume from the FX-Net menu bar and clicked Browser. When the volume browser opens, I make sure Cross Section is selected in my view menu at the top. Next, I select ETA40 from Sources, Rel Humidity from the Basic menu under Fields, and finally, under Planes select LineA in the Specified menu. ETA40 LineA Rel Humidity should appear and be highlighted in the bottom loading window. It is, and I click Load. A loop of relative humidity in cross section view loads in my primary window. Also, the location of the cross section is shown in plan view in a small inset on the top right to give you an idea of where your cross section lies. My example cross section image is here. |
Defining Custom Cross Section Ranges
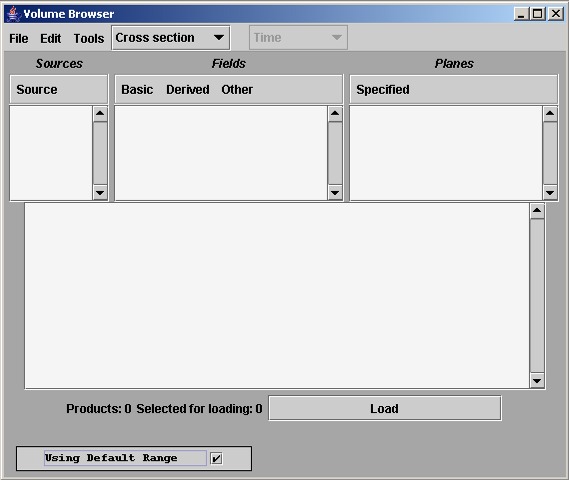
New in version 4.0 is a feature that allows you to select custom vertical ranges when creating a cross section using the volume browser. When you open the volume browser, and select Cross Section from the view type menu, a checkbox and title appear in the bottom of the volume browser, the title saying "Using Default Range." The checkbox will be checked by default, and if you leave it checked, FX-Net will create a cross section with a default vertical range, which on my example above is 1050mb (bottom) to 150mb (top).
If you would like to set different ranges, you uncheck the "Using Default Range" box, and two text boxes appear to the right. You then fill in you custom bottom and top range. 1050mb for the bottom and 500mb for the top will be the default you will see. You can change these to anything you like, and FX-Net will create a plot with those ranges.
Creating a Time Height Prognosis Map
When
you open your volume browser and select Time Height, you can create
yet another type of plot. Time Height maps will display data for
a point over the entire time span of the model. Usually, we have
been looking at forecasts over an area and looping them to get the forecast
over time. Now we will get the forecast for a specific point over
whatever time is available, in one frame. Let's look at one.
|
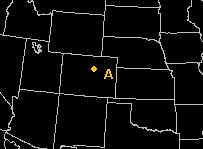
First,
you need to edit the location of a point(s) to use to create a time
height plot. How do I do this?
I did this (shown below) for Point A.
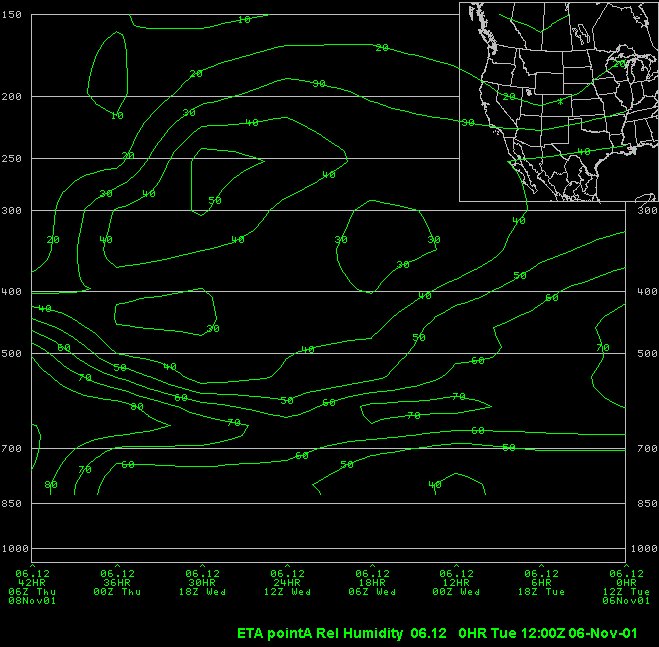
Next, I selected 8 Frames in the FX-Net toolbar, then opened the volume browser and selected Time Height. Under Source I selected ETA40, under Fields I chose Rel Humidity in the Basic menu, and then clicked TsectA under Planes in the Points menu. You will notice that this type of map does not loop through time as all others do. This is because time, shown on the x-axis, is part of this chart. Along the horizontal axis is the valid time of the forecast. Along the vertical axis is height in millibars. So, above each forecast time is a vertical representation of relative humidity above Point A at that particular time. Also, Point A is at high altitude (near Denver, CO), so the data doesn't begin until around 840 mb. View the time height plot here. Note again that there is a small inset map in the top right showing the location of your time height plot, denoted by an asterisk. This helps you remember for what point the data represents. In creating time height plots, when you select Frames on the FX-Net toolbar (always do this first), you are selecting how many time periods to display across the bottom of this chart. You must select at least 2 frames for Time Height forecasts to work. If you want to see all 48 available hours of the ETA40 forecast, you would have to specify 17 Frames instead of 8.
|
Yet another feature of FX-Net is the capability to create model soundings using the volume browser. To create these you must load the baselines and points in the main FX-Net window, and edit the location of a point(s) to use for your sounding location. How do I do this? For more information on interpreting the soundings and the plots shown below, see the Upper Air Page.
|
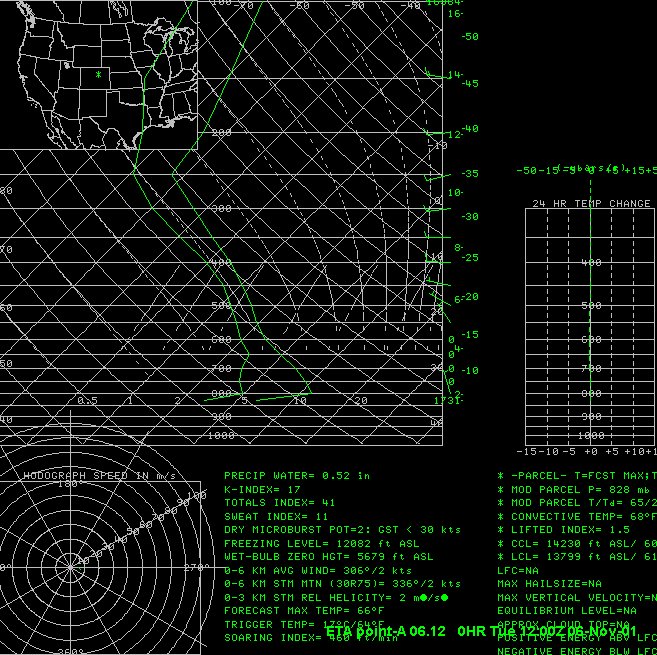
To create the sounding shown here (it was actually one of a loop of 8), I used the same PointA as I used above in my time height plot.
I opened the Volume Browser using the FX-Net menu bar, and selected Sounding from the view menu near the top. Then, I selected ETA40 from the Source menu, Sounding from the Thermo menu, and Sounding A from the Points menu. The result is a loop of model soundings like this one. The sounding is shown, as well as a hodograph, a trace of 24-hour vertical temperature change, and convective parameters on the bottom right. Notice the small inset map on the top right of the sounding, showing the location of the point, denoted by the asterisk, where the model sounding is from. Once again, for help with reading any of this information, see the Upper Air Page. |